Monitoring etcd
Each etcd server provides local monitoring information on its client port through http endpoints. The monitoring data is useful for both system health checking and cluster debugging.
Debug endpoint
If --log-level=debug is set, the etcd server exports debugging information on its client port under the /debug path. Take care when setting --log-level=debug, since there will be degraded performance and verbose logging.
The /debug/pprof endpoint is the standard go runtime profiling endpoint. This can be used to profile CPU, heap, mutex, and goroutine utilization. For example, here go tool pprof gets the top 10 functions where etcd spends its time:
The /debug/requests endpoint gives gRPC traces and performance statistics through a web browser. For example, here is a Range request for the key abc:
Metrics endpoint
Each etcd server exports metrics under the /metrics path on its client port and optionally on locations given by --listen-metrics-urls.
The metrics can be fetched with curl:
Health Check
Since v3.3.0, in addition to responding to the /metrics endpoint, any locations specified by --listen-metrics-urls will also respond to the /health endpoint. This can be useful if the standard endpoint is configured with mutual (client) TLS authentication, but a load balancer or monitoring service still needs access to the health check.
Since v3.4, two new endpoints /livez and /readyz are added.
- the
/livezendpoint reflects whether the process is alive or if it needs a restart. - the
/readyzendpoint reflects whether the process is ready to serve traffic.
Design details of the endpoints are documented in the KEP .
Each endpoint includes several individual health checks, and you can use the verbose parameter to print out the details of the checks and their status, for example
and you would see the response similar to
The http API also supports to exclude specific checks, for example
Prometheus
Running a Prometheus monitoring service is the easiest way to ingest and record etcd’s metrics.
First, install Prometheus:
Set Prometheus’s scraper to target the etcd cluster endpoints:
Set up the Prometheus handler:
Now Prometheus will scrape etcd metrics every 10 seconds.
Alerting
There is a set of default alerts for etcd v3 clusters for Prometheus.
Note that job labels may need to be adjusted to fit a particular need. The rules were written to apply to a single cluster so it is recommended to choose labels unique to a cluster.
Grafana
Grafana has built-in Prometheus support; just add a Prometheus data source:
Then import the default etcd dashboard template
and customize. For instance, if Prometheus data source name is my-etcd, the datasource field values in JSON also need to be my-etcd.
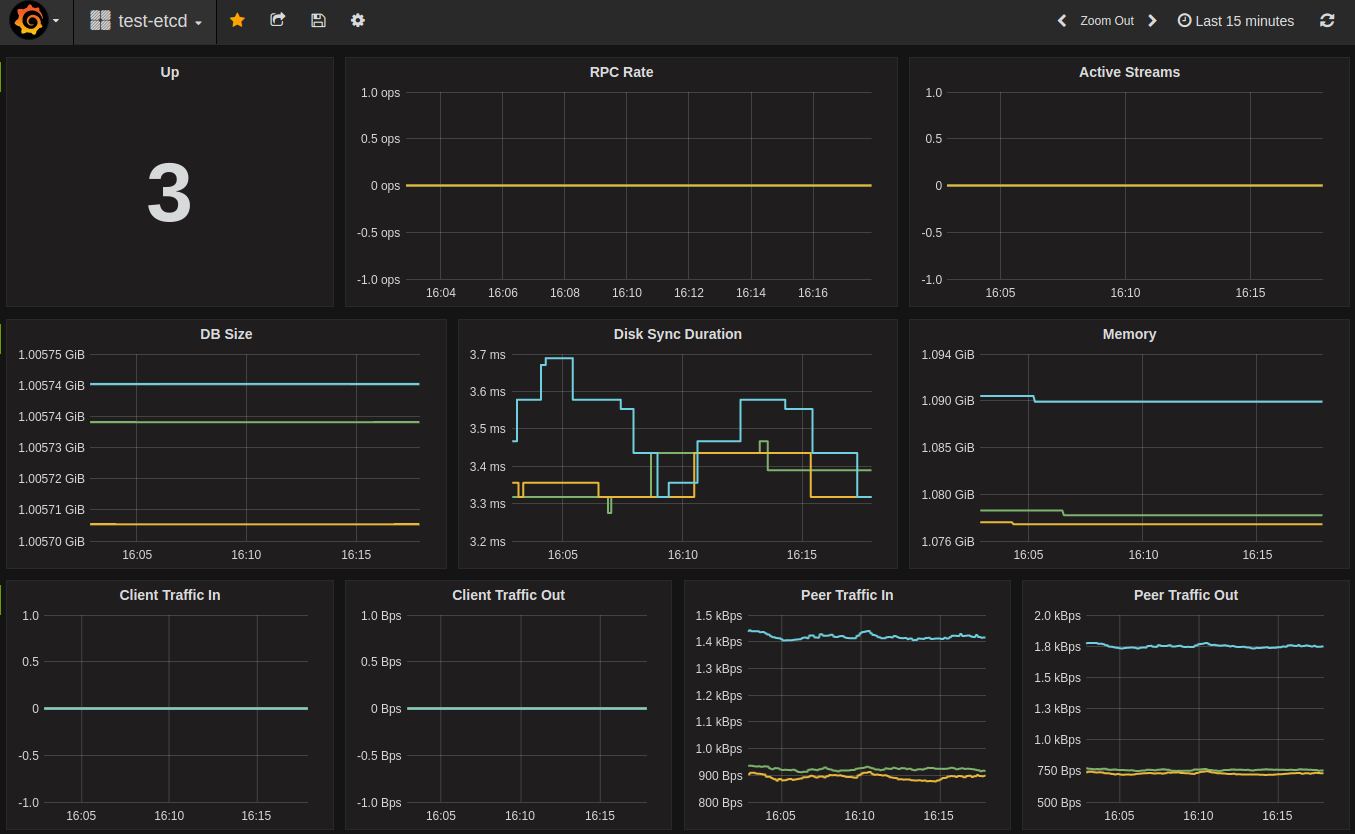
Sample dashboard:
Distributed tracing
In v3.5 etcd has added support for distributed tracing using OpenTelemetry .
This feature is still experimental and can change at any time.
To enable this experimental feature, pass the --experimental-enable-distributed-tracing=true to the etcd server, along with the --experimental-distributed-tracing-sampling-rate=<number> flag to choose how many samples to collect per million spans, the default sampling rate is 0.
Configure the distributed tracing by starting etcd server with the following optional flags:
--experimental-distributed-tracing-address- (Optional) - “localhost:4317” - Address of the tracing collector.--experimental-distributed-tracing-service-name- (Optional) - “etcd” - Distributed tracing service name, must be same across all etcd instances.--experimental-distributed-tracing-instance-id- (Optional) - Instance ID, while optional it’s strongly recommended to set, must be unique per etcd instance.
Before enabling the distributed tracing, make sure to have the OpenTelemetry endpoint, if that address differs to the default one, override with the --experimental-distributed-tracing-address flag. Due to OpenTelemetry having different ways of running, refer to the collector documentation
to learn more.
There is a resource overhead, as with any observability signal, according to our initial measurements that overhead could be between 2% - 4% CPU overhead.